
Research Report. Metre by Metre: Street Level Impact of Heat Stress in Brighton & Hove City Centre to enable ultra-targeted adaptation
Metre by Metre: Street Level Impact of Heat Stress in Brighton & Hove City Centre to enable ultra-targeted adaptation
Hannah Dunsby
Key points:
This study maps fine-scale variation in outdoor thermal conditions across a 1km² area of central Brighton.
During heatwave conditions, large parts of Brighton reach moderate or high heat stress, and the study is precise enough to say exactly where. Open spaces, wide streets, and areas around transport hubs come out worst.
As a general pattern across the city, heat stress is higher on southern and eastern edges of buildings than the northern and western sides, most clearly on North Street and Church Street.
The reduction in thermal stress associated with green spaces was mixed, with some nocturnal thermal stress relief but limited impact overall. Tree cover was found to be associated with reductions in stress.
Cooler streets are likely to bring real benefits for health, comfort and productivity, especially for people already more vulnerable to heat.
The value of the findings is in highlighting the importance of targeted adaptation measures, such as increasing shade and vegetation in key hotspots. Three priority actions are:
Extend the mapping. This paper covers just over 1km² of central Brighton; a larger, citywide study using the same approach would extend this precision to the rest of Brighton & Hove.
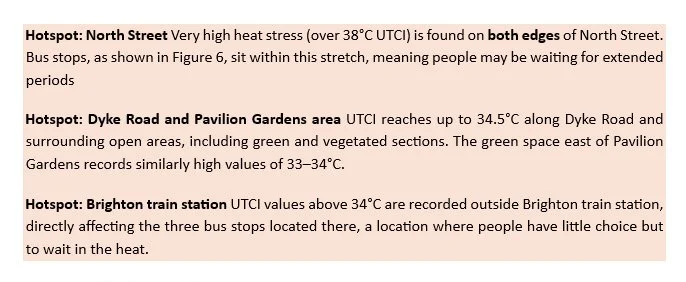
Target the worst-affected locations first. The Brighton station area, the wide streets of Dyke Road and North Street, which also have multiple bus stops, and areas with high numbers of outdoor cafes and restaurants such as New Road stand out as clear starting points for shade and vegetation interventions.
Feed the findings into tools people already use and those being developed, such as the Cool Spaces Map, so residents can act on them directly. This supports individual level adaptation and enhances the accessibility of these findings.
Introduction
Urban heat is a growing concern as climate change and the urban heat island effect combine to cause high urban temperatures, with serious implications for public health and the economy. Whilst air temperature has traditionally been used to assess heat exposure, it does not capture fine-scale variation within cities. This paper fills this gap, providing evidence for planners to deliver ultra-targeted adaptation strategies, and for individuals to understand and minimise their exposure.
This is the first time that heat stress in Brighton and Hove has been mapped at street level. Covering just over a square kilometre of the city centre at one-metre resolution, it shows how conditions change from one side of the road to the other. The result is evidence that planners can use to target cooling where it is needed most, and that residents, business, workers and residents can use to reduce their own exposure to heat.
This work is a summary version of a dissertation completed in 2025 as part of the Climate Change, Development and Policy MSc at the University of Sussex. The full text, including methodology, is available on request. References are in a separate document, here. A pdf of the summary paper can be downloaded here.
Table 1
Key terms
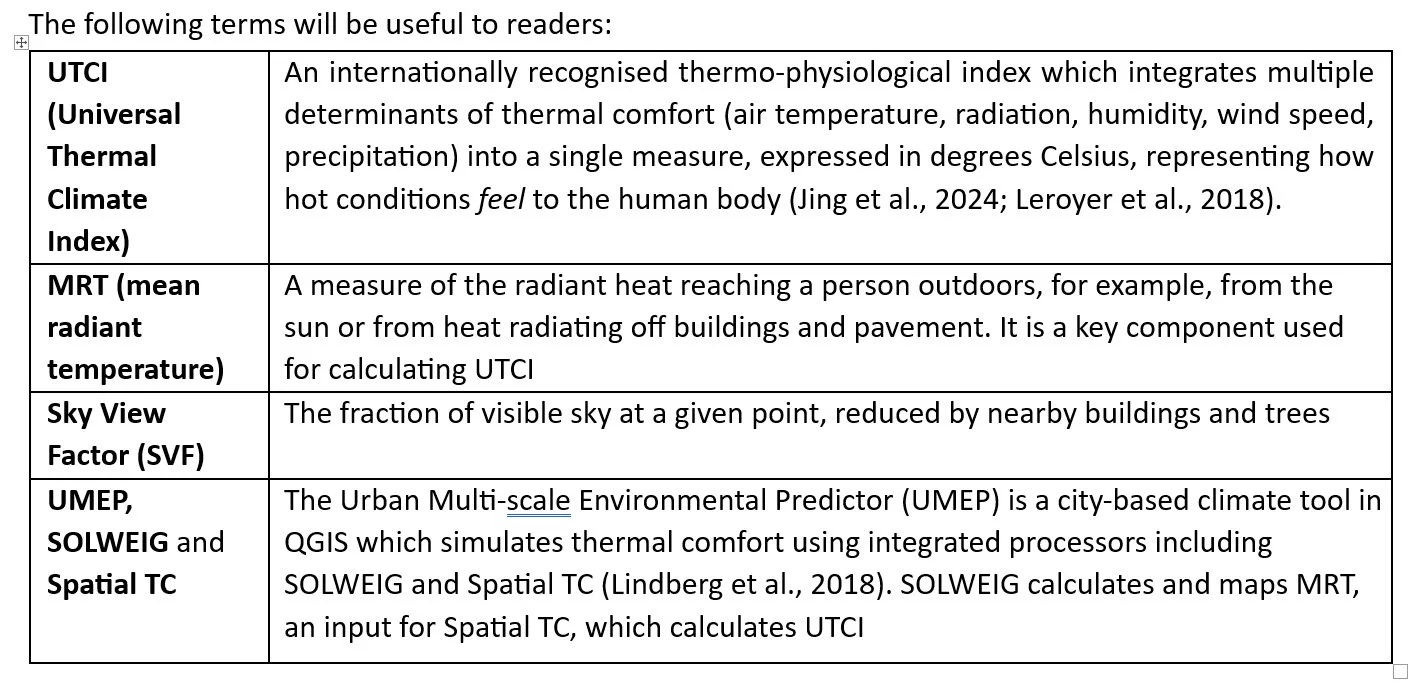
Background: urban heat and how we measure it
Urban heat is a growing concern as climate change and the urban heat island effect combine to cause high urban temperatures, which can have serious implications for public health and the economy. The urban heat island (UHI) effect means the 84% of the UK population living in cities and towns are particularly vulnerable to the serious health and economic implications of extreme heat, including reduced productivity and increased morbidity and mortality (Green Alliance, 2024).
Whilst air temperature has traditionally been used to assess heat exposure, human heat stress and comfort depend also on radiant load, wind, and humidity. This leads to substantial heterogeneity on the urban outdoor micro-scale, such as on the street-level (Siret et al., 2025; Xie et al., 2022; Vasilikou and Nikolopoulou, 2020). These variations inform thermal (dis)comfort and heat stress, informing the ‘feels like’ quality of the microclimate and potentially inducing physiological responses in the body (City of London Corporation, 2020; Antoniou et al., 2024). Therefore, a branch of urban microclimate studies has emerged, mapping ‘real feel’ outdoor temperatures, considering all of these factors, to extremely fine resolutions, supporting targeted adaptation planning.
Why does this matter for Brighton and Hove?
Localised thermal comfort and stress influences the experience of walking, cycling and active travel, impacting the uptake of these methods with potential impact on greenhouse gas emissions (City of London Corporation, 2020; Kim and Brown, 2022).
Areas with high levels of thermal discomfort continue to affect pedestrians for up to 35 seconds after passing through them, so even small hotspots matter (Xie et al., 2022).
Mapping these micro-scale variations allows exposure to be limited through well-targeted adaptation strategies, such as increased tree cover.
Easily-communicated indices like UTCI help improve public understanding of current and future risks, countering the perception of heat as an "invisible risk" or a purely positive phenomenon in the UK.
Table 2
UTCI Stress Categories: how heat stress is measured
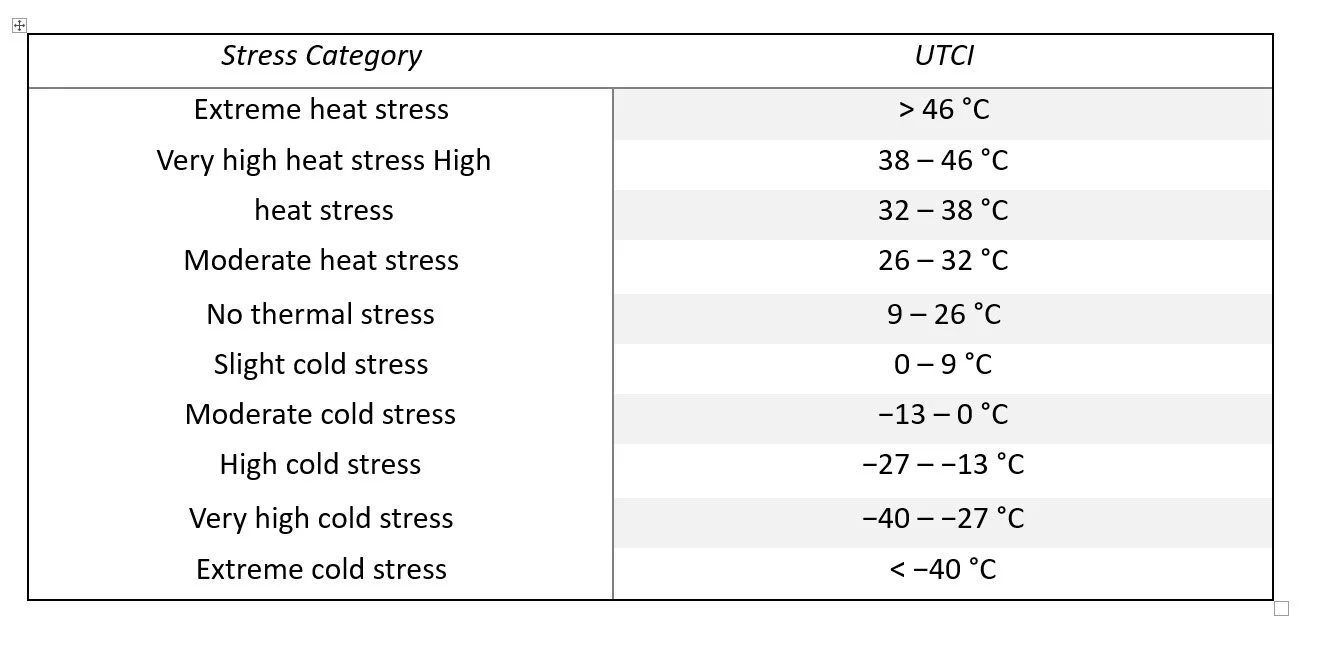
Source: adapted from Matzakaris et al., 2014
Europe-wide evidence suggests that mortality rates increase in conditions of moderate (above 26℃) and high (above 32℃) UTCI. However, in cooler climates, such as in the UK, deaths are also associated with conditions of no thermal stress, particularly above 20℃ UTCI (Di Napoli et al., 2018).
This is the first study mapping micro-scale thermal variation in Brighton & Hove. It is anticipated that this work will have value for Brighton & Hove City Council (BHCC) by identifying precise areas of significant thermal discomfort and consequently areas of the city where adaptation efforts could be targeted. This work complements an existing UHI assessment covering the entire city of Brighton & Hove at a coarser resolution, as shown in Figure 1, and meets calls for more detailed, area specific assessments which support targeted adaptation (Coleman, 2024; Arup and BHCC, 2023).
Figure 1
Map showing Brighton & Hove Surface UHI with neighbourhood labels
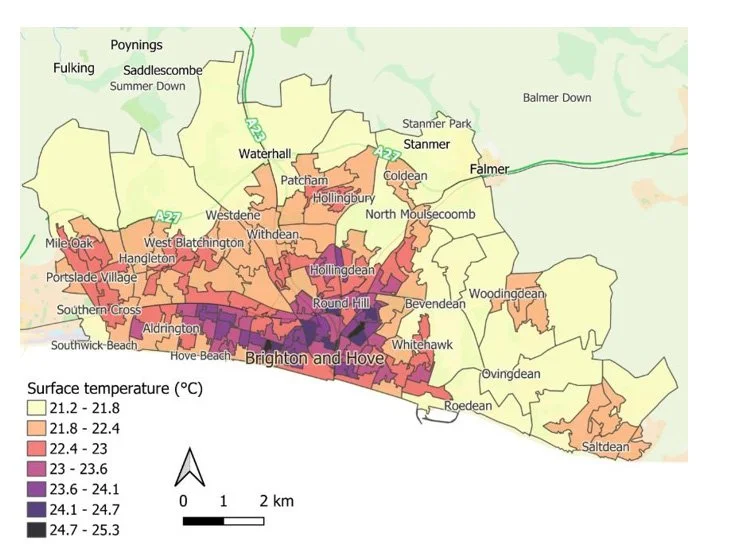
Source: Arup and BHCC 2023
Methodology:
The study area encompasses the majority of both the Regency (population 9,800) and West Hill & North Laine (population 10,500) wards (ONS, 2025). This study area measures just over 1km by 1km, covering high-footfall areas of central Brighton. See Figure 2.
Figure 2
Location of the study area and reference meteorological station
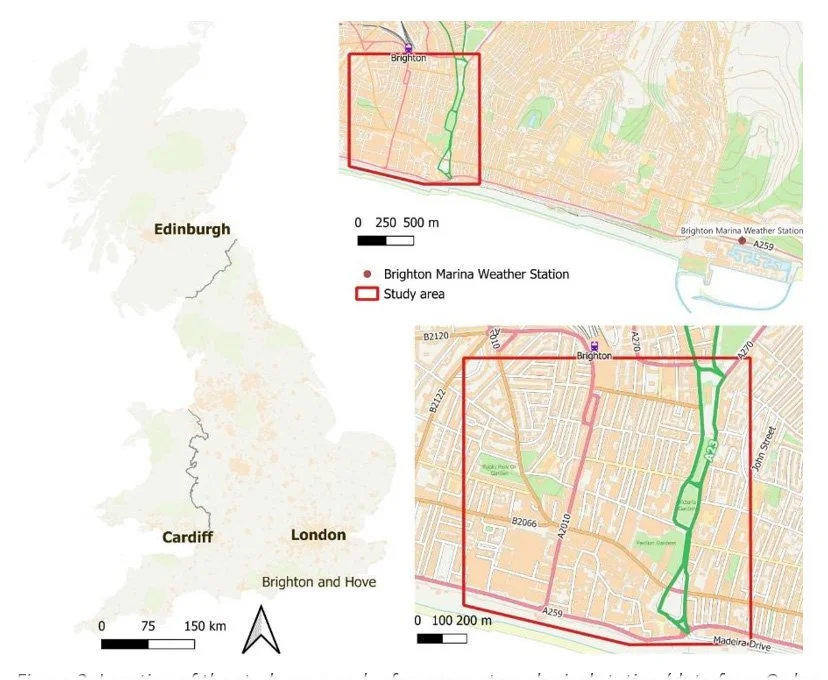
Source: data from Ordnance Survey, 2025
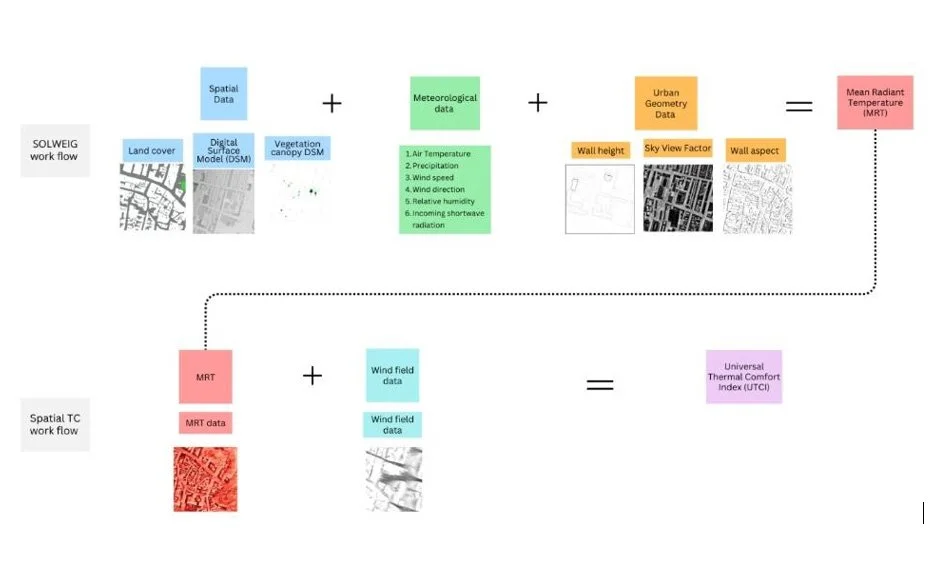
Meteorological data was used as an input to the SOLWEIG model, set out in Figure 3, to simulate conditions in the summer of 2022, as well as future conditions for 2050 and 2080 under the SSP24.5 scenario. This paper focuses primarily on the 2022 simulated findings, as barriers to accessing future extreme-temperature projections limit how far these can be compared to the 2022 results.
Data from the Brighton Marina weather station, location shown in Figure 2, was selected for input meteorological data, due to proximity to the study area, and location both in an urban area and near to the sea, accurately representing conditions in the study area. Data for analysis was selected from various periods across the summer of 2022, the warmest summer to date in Europe at the time of writing, with record-breaking temperatures of over 40°C recorded in parts of England on 19 July (Kay et al., 2025).
Figure 3
Diagram showing the inputs, outputs and workflows of the UMEP processors SOLWEIG and Spatial TC
Source: author's own
High-resolution LIDAR data from the National LIDAR Programme was the source of the spatial data, to create the DSM, DTM and vegetation DSM (Environment Agency, 2025). This allows accurate modelling, accounting for exact building and vegetation height, including individual trees and private gardens, often excluded from land use datasets (Lindberg and Grimmond, 2011; Kong et al., 2022; Buo et al., 2023).
Study limitations and potential for future research:
Input data quality: results are primarily determined by the quality of input data. Efforts were made to ensure this was high-quality and accurate, but limitations remain, particularly for the future-projections , which is why this paper focuses on 2022 findings.
Computing power: using a single personal computer limited the study area size and number of hours simulated. The 1-metre resolution used accurately captures the impact of trees, alleyways and houses, but this comes at a trade-off, meaning 1km² was the maximum feasible study area (Dirksen et al., 2019; Quanz et al., 2018; Siret et al., 2025; Antoniou et al., 2024; Kim and Brown, 2022).
UTCI's computational cost: calculating UTCI requires wind field data, which is also computationally expensive. UTCI outputs are therefore limited to selected hours.
Uniform meteorological input: the meteorological conditions used as input were uniform across the study area, so the UHI effect was not factored in. This means thermal stress may be underestimated in the built-up areas of the city, where the UHI effect is more pronounced (Rana et al., 2023), a factor to consider in future research.
Results: where do we find the heat stress
During heatwave conditions, large parts of the city experience moderate or high heat stress as measured by UTCI, with the most intense values found in open spaces, wider streets, and around transport hubs. See Figures 4 and 5.
Figures 4 (above) and 5 (below)
Maps showing UTCI by value and thermal stress category for 10am-3pm, 10-12th August 2022
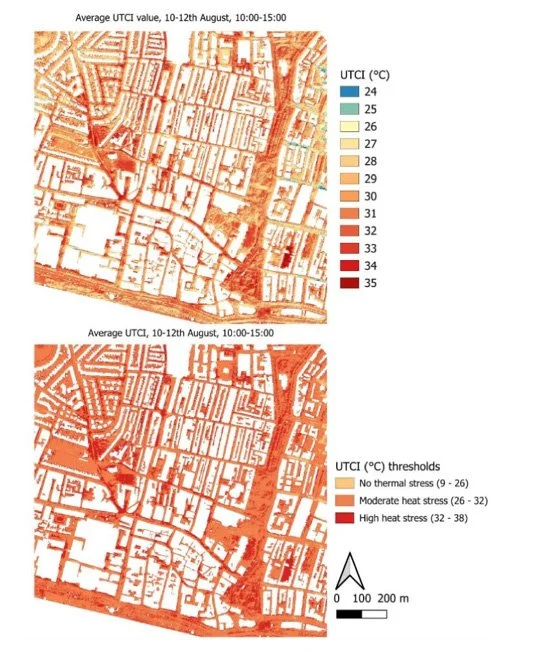
Over the three days, average UTCI indicates moderate or high heat stress across the vast majority of the study area. The only exceptions are a few relatively small areas along the eastern side, where UTCI averages 24–25°C - just below the threshold for moderate heat stress, and still significantly above the 20°C threshold found to be associated with mortality effects in cooler climates. The largest continuous areas of high heat stress are found in open spaces and along wider streets, and southern building edges consistently record higher UTCI than other orientations.
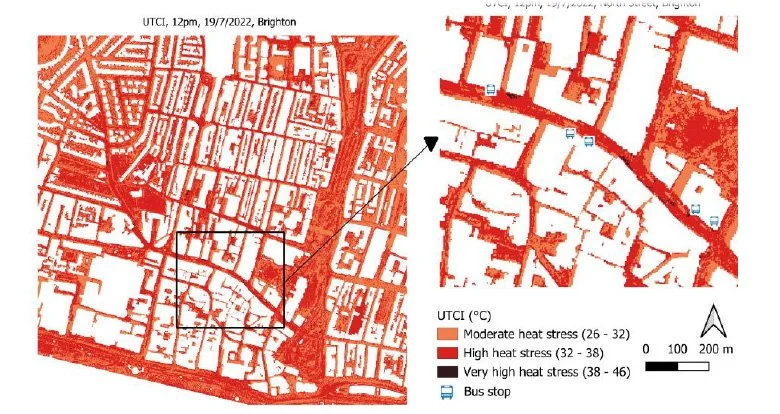
Looking more closely at an extreme heat event, 12 pm on the 19th July 2022, shown in Figure 6, the entire study area experienced at least moderate heat stress, with certain areas experiencing very high heat stress of over 38°C UTCI. The fine-scale heterogeneity is also clear in this figure. Temperature differences of over 6°C occur over distances of less than 100 m, indicating that local morphology and shading from buildings exert strong influences on outdoor thermal stress.
Figure 6
Map showing UTCI at 12pm on the 19/7/2022, with a panel showing a section of North Street with very high heat stress
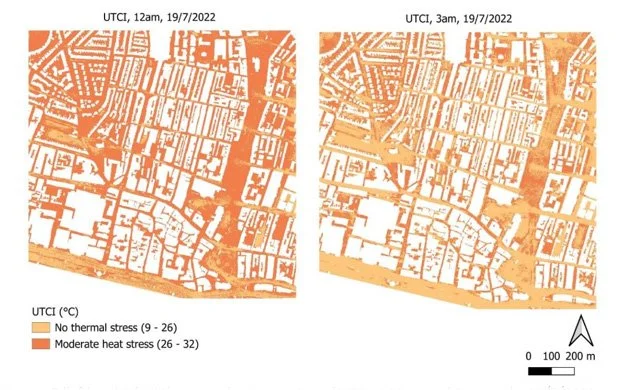
At midnight, moderate heat stress was still experienced across much of the study area (Figures 7 and 8). By 3am, the proportion of the study area which is under no thermal stress has markedly increased. Areas of moderate thermal stress remain on narrow streets which are oriented north-south, and areas of Victoria Gardens which are bounded to the east and west by buildings. Even so, the entire study area at both midnight and 3am had simulated UTCI of over 22°C, over the 20°C calibrated threshold associated with health implications.

Figures 7 (left) and 8 (right)
Maps showing nocturnal UTCI at 12am and 3am on the 19/7/2022
Implications: what this means for Brighton and Hove’s residents and visitors
Health
Significant heat stress has meaningful mortality implications, particularly for the over-65 population (UKHSA, 2023; Ebi et al., 2021).
Brighton & Hove has a higher-than-average rate of serious mental health conditions; extreme temperatures are associated with worsened mental health outcomes (NHS & BHCC, 2014).
Homeless people are particularly vulnerable to heat extremes (Green Alliance, 2024; NHS, 2011). Brighton & Hove has one of the highest rates of homelessness in the country outside of London – 1 in every 77 people are homeless (Shelter, 2024).
Brighton's tourist industry is at times associated with heavy alcohol consumption; alcohol during heat extremes increases dehydration and impairs decision-making, raising mortality risk (Ebi et al., 2021; NHS, 2011).
Moderate-to-high heat stress along seafront locations (high radiation/sunlight) may lead to heat stroke for large numbers of people, generating costs for local NHS services and potential impacts on service delivery.
Economy
Extreme heat could offer a tourism opportunity for Brighton & Hove, where air temperatures tend to run cooler than some inland areas, but the heat stress identified in the central, economically-active parts of the study area may work against this.
Specific streets show consistently high thermal stress on their southern and eastern building edges across both the July and August heatwaves, notably North Street and Church Street.
The eastern edge of New Road (just outside Pavilion Gardens) shows high heat stress in both periods; this stretch has a significant number of restaurant and café terraces, with potential negative health and productivity impacts for service staff.
High UTCI in open spaces, Old Steine, Victoria Gardens, and St Peter's Church may have implications for exposure during outdoor events.
Adaptation: what would address the specific hotspots
UTCI values are found to vary on extremely fine scales, with different sides of the same road commonly experiencing different levels of thermal stress. This highlights the value of work using this spatial resolution in understanding risk and targeting adaptation strategies. Reductions in outdoor thermal stress may benefit health, comfort, and urban productivity, particularly for vulnerable groups.
To understand how different adaptation strategies might affect micro-scale heat stress, the study examined the relationship between simulated MRT and both Sky View Factor (SVF) and vegetation cover (MRT was used rather than UTCI, as it shows greater variability and is a key input to UTCI - reductions in MRT will lead to reductions in UTCI).
Open areas with less shading are consistently warmer – the strongest correlation between a spatial feature and temperature is found between reduced SVF and MRT[1]. In a built-up area such as the study area, SVF is primarily determined by building height with vegetation cover having a secondary influence. Therefore, whilst decreasing SVF could lead to lower thermal stress, it is unlikely to be a practical solution. Even if increasing building height was physically possible, it would also reduce desirable winter sunlight hours and be unlikely to be attractive aesthetically.
Looking therefore at the impact of vegetation, a 10% increase in vegetation cover corresponds to a reduction of 0.58°C in daytime average MRT, and around 1.89°C off the daytime peak[2], suggesting vegetation is particularly effective at reducing the most extreme moments. The feasibility of this is supported by Treeconomics (2023) who identified 1,656 potential planting sites across the Regency and West Hill & North Laine wards, covering most of this study area, of which 86.75% are rated high priority for impact. However, exact cooling effects may vary by local context, canopy distribution, and building morphology. Therefore, the potential MRT reduction values should be interpreted as indicative rather than absolute predictions.
One important consideration is that grass alone does not guarantee cooler conditions. In the study area, average MRT is marginally higher on grass than urbanised land. This is likely due to higher SVF in these areas from reduced building shading. For maximum MRT, both mean and median values are slightly lower for grass than for urban land. This indicates that grass land cover does not guarantee cooler conditions, shading is key.
Conclusion:
This is the first street level study of its kind for Brighton & Hove, providing new evidence of microscale heat exposure and contributing to a body of research that can inform targeted, locally appropriate adaptation and mitigation strategies.
This study demonstrates that moderate and high heat stress is already widespread across the city. As both UTCI and MRT values are found to vary on extremely fine scales, with different sides of roads experiencing different levels of thermal stress, this work enables an understanding of exactly where the worst of the heat stress falls. This highlights the value of work using this spatial resolution for understanding risk and targeting adaptation strategies.
Daytime thermal stress, as measured by UTCI, reaches moderate and high thresholds across the vast majority of the study area during heatwave conditions. Whilst nocturnal heatwave conditions simulated for the 19th of July 2022 do not always meet the threshold for moderate heat stress, they remain above the 20°C threshold which is associated with increases in mortality in the UK (Di Napoli et al., 2018).
Whilst increased extreme heat may provide an opportunity for tourism revenue for Brighton & Hove, where air temperatures tend to be lower compared to some inland areas, the heat stress in central parts of the study area, where economic and business activity is concentrated may have negative implications. It is likely that heat stress may already, or in the future, lead to reduced productivity and negative health outcomes for outdoor workers in the service industry (UK Climate Risk, 2021a).
The significant levels of heat stress simulated in this study have meaningful implications for health in terms of mortality, particularly for the over-65 population (UKHSA, 2023; Ebi et al., 2021). Of particular relevance to Brighton & Hove, where the number of people with serious mental health conditions is higher than the national average, is the association of extreme temperatures with worsened mental health outcomes (NHS & BHCC, 2014). In addition, health risks for homeless people, particularly those who are street homeless and those living in certain types of temporary accommodation, who are particularly vulnerable to heat extremes, are significant (Green Alliance, 2024; NHS, 2011)
Even modest reductions in thermal stress in the areas most at risk are likely to help reduce overall exposure, supporting public health, lowering risks for vulnerable groups, and supporting the urban population to be more productive economically and resilient to climate change impacts. Impact can be maximised by targeting areas where stress and vulnerability is currently the highest. Use of the maps produced in this study is the best way to identify these spaces.
We therefore return to three priority actions:
to extend the mapping;
to target the clearly identified worst-affected locations first; and
to integrate this data into existing and developing tools, for example the Cool Spaces Map,.
The findings in this paper provide a clear imperative for putting these recommendations into place.
___________
Hannah Dunsby holds an MSc in Climate Change, Development and Policy from the University of Sussex.
Perspective pieces are the responsibility of the authors, and do not commit Climate:Change in any way. Comments are welcome.