
Meeting Report. Food and Climate: From Mapping to Policy
Food and Climate: From Mapping to Policy
Key Points:
Food accounts for 20-30% of total greenhouse gas emissions - in the world and in the UK;
Mapping emissions provides both a baseline and a platform for action;
In Brighton and Hove, emissions may be about 1.5 tons per person per year - but better data are needed on the three key pillars of food consumption: households, institutions and hospitality;
Eating less meat and reducing waste are key to reducing emissions;
Brighton and Hove can learn a lot from other cities leading the way: Copenhagen, Milan, Ghent, and others.
Climate:Change organised two meetings on 28 April 2026 to discuss Brighton and Hove’s food footprint. The first was a technical workshop on ‘Tracking the GHG Emissions Associated with Food in Brighton and Hove’. The second was a policy-focused public meeting, ‘Food and Climate: From Mapping to Policy’.
Two guest speakers participated in both meetings: Kristin Strandberg, Cities Lead for Circle Economy in the Netherlands; and Hamish Forbes, Senior Analyst at WRAP. In addition, James Joughin, food lead for Climate:Change, spoke at the public meeting. All three had Powerpoint presentations – Kristin here, Hamish here, and James here. There was also frequent reference to the latest estimates of the Leeds University Place-Based Carbon Calculator, estimating emissions per person for the UK down to the level of a few streets.
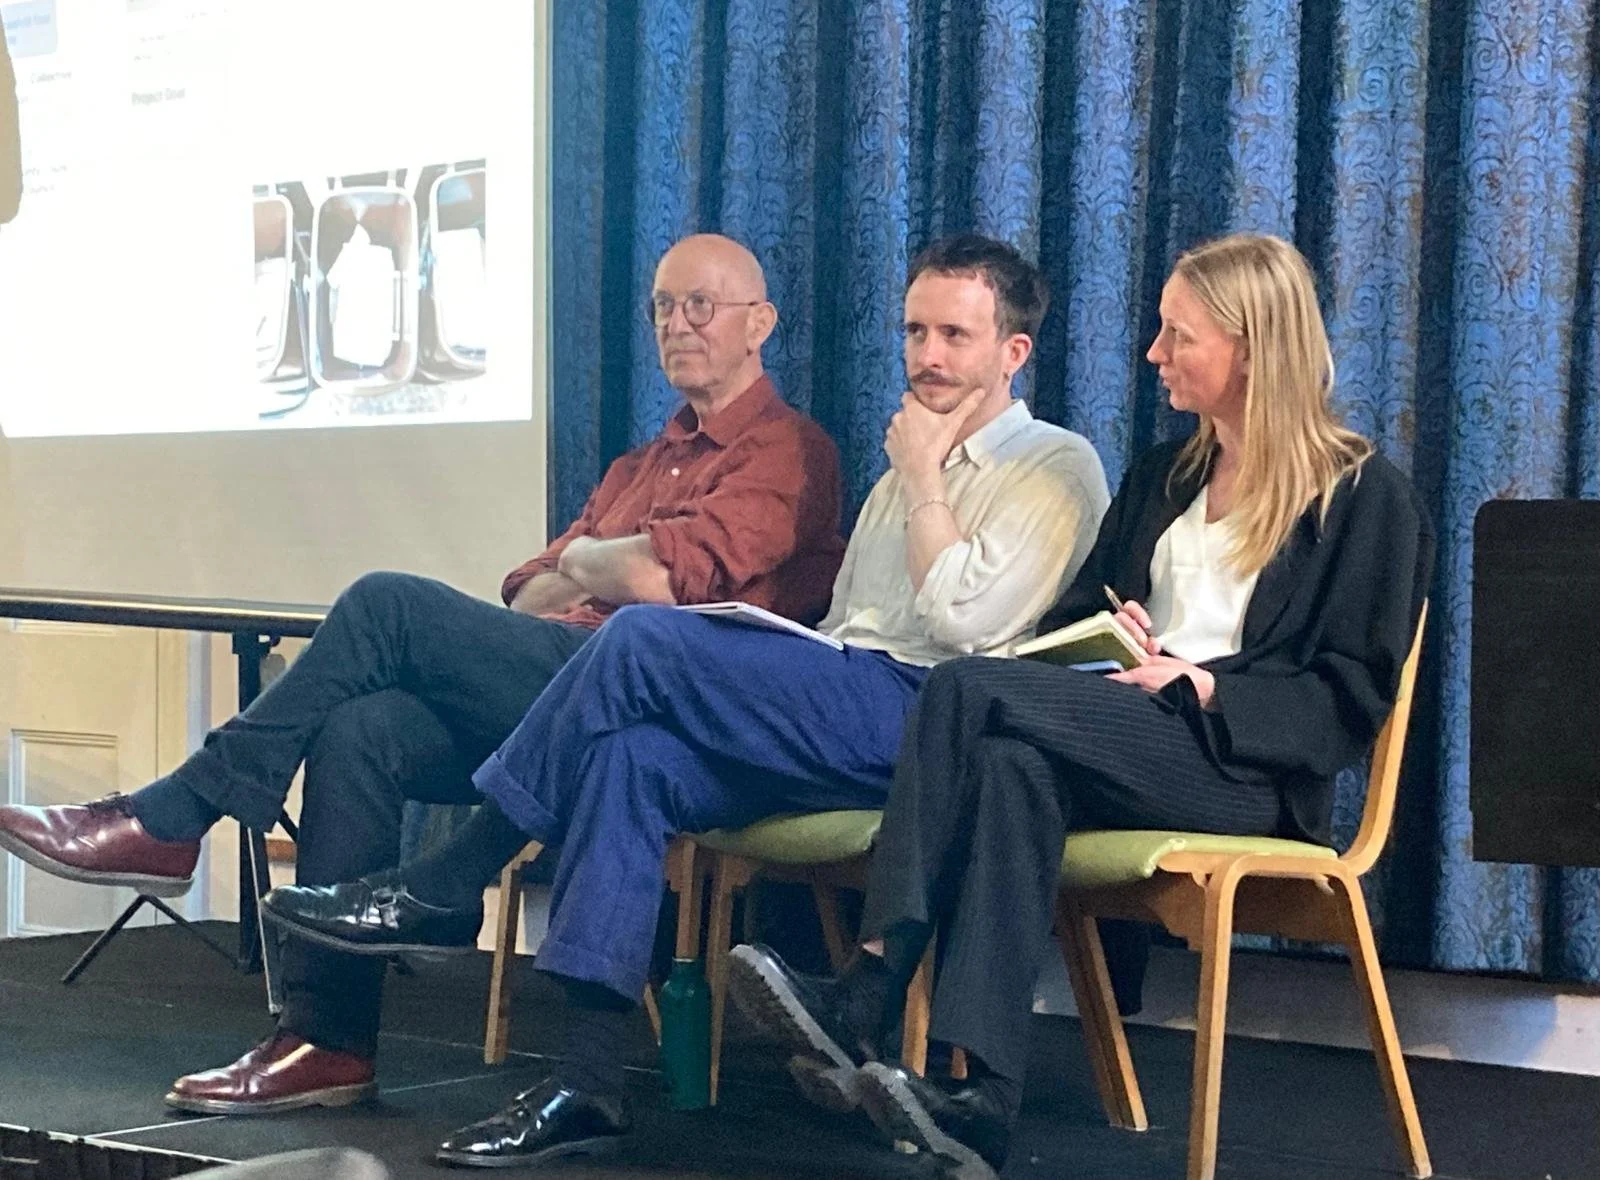
(L-R) James Joughin, Hamish Forbes, Kristin Strandberg
Mapping the City’s food footprint
The reason to estimate the food footprint – to map it – was clear: to provide a baseline, to help build a platform for action, and to enable monitoring. Globally, emissions associated with the food system accounted for 20-30% of all emissions. This was also true in the UK. Thus, food footprint mapping was central to climate action.
There were different approaches to measurement: starting with a material flow analysis, as was the case in Circle Economy’s pioneering study of the London food footprint (here); looking at emissions sector by sector, as was the case for WRAP’s analysis of the UK food footprint (here); or working with household expenditure data, as was the case for the Place-Based Carbon Calculator (here). There was no right or wrong way. Each approach had strengths and weaknesses, and each yielded different insights at different levels of aggregation.
For Brighton and Hove, there were three main pillars of the food system, as discussed in the Briefing Paper for Climate:Change by James Joughin (here). and at the public meeting on the topic (here). The three pillars were (a) households, (b) institutions (including hospitals, schools and businesses): and (c) the important hospitality sector (with up to 1400 bars, restaurants and cafes serving food in the City). Brighton and Hove was not producing food on any scale, despite the area of downland within the City, and was not a food manufacturing or processing centre, so mainly the focus was on consumption.
None of the approaches considered quite broke the food footprint down in as much detail as the City might wish. However, each provided information that could be adapted for use in Brighton and Hove.
The national estimate prepared by WRAP (Figure 1) was notable for working systematically through the food system, considering domestic production, imports and exports, the impact of land use change and all elements of processing and distribution, including shoppers driving to the supermarket. It gave a national estimate of 167m tons of emissions from the food system in 2023, equivalent to 2.4 tons per head for the country as a whole.
Figure 1
The UK’s food footprint
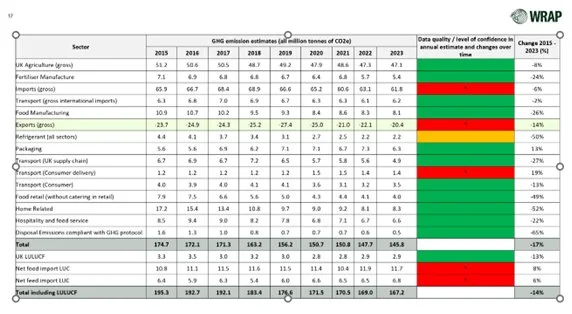
Source: Hamish Forbes presentation https://www.climatechangebh.org.uk/s/Hamish-Forbes-Presentation.pdf
The London food system work of Circle Economy gave a total of 15.5 m tons in 2019, equivalent to 1.7 tons per head (Figure 2). Coverage was not the same as WRAP – for example, driving to the supermarket was not included.
Figure 2
The Sankey diagram for London food
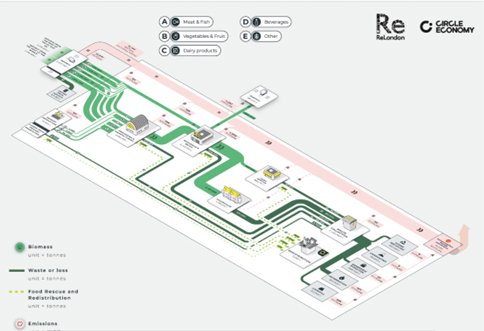
Source: Kristin Strandberg presentation: https://www.climatechangebh.org.uk/s/Kristin-Strandberg-PP.pdf
The approach of the Place-Based Carbon Calculator was based on household expenditure data, as noted, converted into individual per capita estimates. For Brighton and Hove, the average was 1.4 tons per capita, excluding alcohol and restaurants. There was a considerable variation across the City, reflecting inequality, although less than for emissions as a whole. An example is in Figure 3.
Figure 3
Carbon footprint for a district in Brighton and Hove
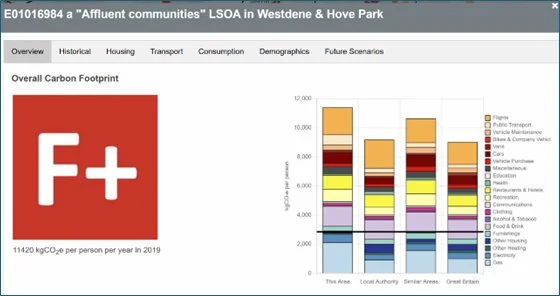
Source: https://www.carbon.place/pbcc/#/zones/
A question discussed at the events was whether this range – 1.4-2.4 tons per head – actually mattered, or whether a rough estimate of, say, 1.5 tons per capita, would ‘do’. There was agreement that estimates would never be precise, but that there was scope to narrow the difference, and also fit the data more accurately to the three pillars of Brighton and Hove’s food economy. Kristin suggested amendments to the method used in London, including better information on the tourist economy, and more on institutions (Figure 4).
Figure 4
Adapting the London footprint analysis to Brighton and Hove
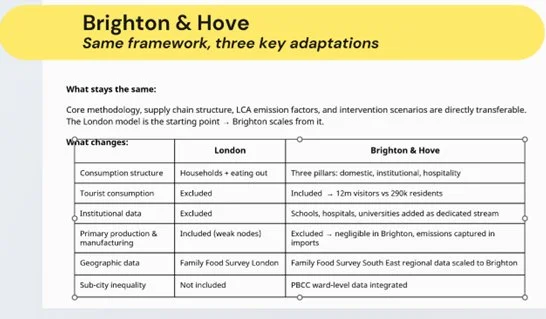
Source: Kristin Strandberg presentation: https://www.climatechangebh.org.uk/s/Kristin-Strandberg-PP.pdf
There was good progress on these refinements, especially at the technical workshop. For example, the NHS had good data on procurement and there seemed to be real potential to acquire data from other institutions on procurement. And the Sustainability Toolkit built by Restaurants Brighton and the University of Brighton (here) had the potential to provide valuable data. There was no doubt, however, that further data collection would be needed.
Acting to reduce emissions
When it came to actions, there were two stand-out sets of recommendations, the first to do with diet, eating less meat (especially red meat) and dairy, and the second with reducing waste. Both the WRAP study and the Circle Economy study illustrated the potential. The London study showed that emissions could be cut by 20% by reducing meat consumption and a further 19% by reducing and better managing waste (Figure 5). The WRAP study also emphasized waste management in the context of a transition to net zero by 2050. It was recognized in the discussion how important it was to understand behaviour change; this was the theme of a separate workstream for Climate:Change (see here for a Briefing Paper by Natasha Parker, and here for the report of a workshop on the topic).
Figure 5
Options to reduce the food footprint in London
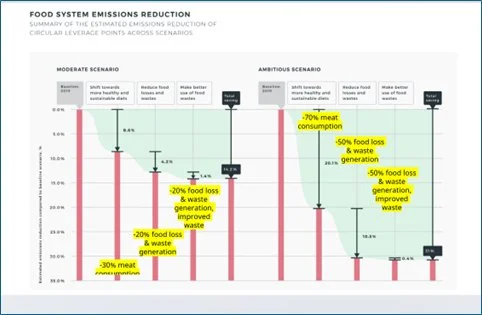
Source: Kristin Strandberg presentation: https://www.climatechangebh.org.uk/s/Kristin-Strandberg-PP.pdf
This did not mean that farming and food processing were off the agenda. WRAP had important work on the production side, including supporting farmers on the adoption of low carbon practices (Figure 6). For Brighton and Hove, there were options to support local food production and make better use of the downland estate. The Food Partnership has done interesting work in this area, under the umbrella of the Brighton and Hove Food Strategy (here). There were also opportunities to work more with supermarkets on processing, packaging and marketing, though engagement at national level would be necessary to take this forward.
Figure 6
Net Zero Transition Plan for Food
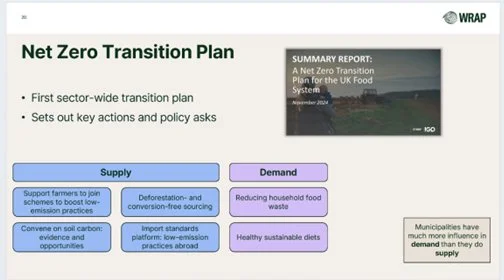
Source: Hamish Forbes presentation https://www.climatechangebh.org.uk/s/Hamish-Forbes-Presentation.pdf
There was quite a discussion about what the City, and cities in general, could do to reduce emissions. Kristin provided a five-sided model of urban policies, covering market signals, rule-setting, education and mobilisation (Figure 7).
Figure 7
A policy model for reducing the food footprint
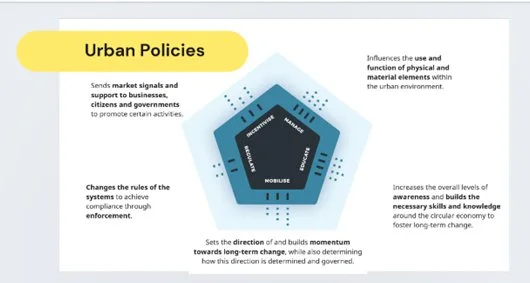
Source: Kristin Strandberg presentation: https://www.climatechangebh.org.uk/s/Kristin-Strandberg-PP.pdf
She gave examples from Copenhagen, Milan, Ghent, Mouans-Sartoux in France, and others, with impressive results:
A 25% reduction in the carbon footprint of municipal food service in Copenhagen, and a requirement for 90% organic sourcing;
A logistics platform in Ghent to help buyers source locally, and a target for 60% of protein to be of vegetable origin;
100% organic food in canteens in Mouans-Sartoux, and 50% vegetarian meals;
Businesses in Milan donating surplus food to be eligible for tax rebates;
In Flanders, a ban on biodegradable waste in landfill.
All this was promising. It was important, though, to recognize the rapidly changing nature of the food system, facing multiple challenges of corporate control as well as geopolitical challenges. James Joughin reviewed some of these (Figure 8). There were many actual and potential shocks that could disrupt smooth progress towards net zero in the food system. It was repeatedly emphasized that inequality needed to be addressed along the way. GHG neutrality was a priority for food policy, but far from the only one. For example, the link between diet and health was central.
Figure 8
The food crisis
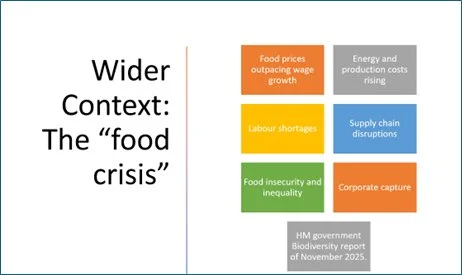
Source: James Joughin presentation https://www.climatechangebh.org.uk/s/James-Joughin-presentation.pdf
What would be the way forward? On food policy generally, James Joughin suggested some rules of thumb, starting with creating momentum around collective action (Figure 9).
Figure 9
Towards policy: Rules of Thumb
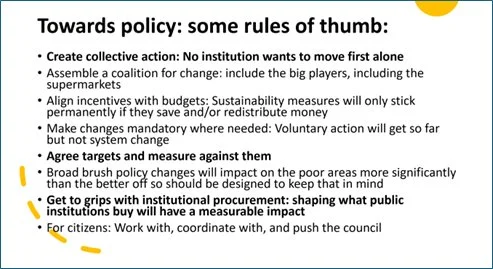
Source: James Joughin presentation https://www.climatechangebh.org.uk/s/James-Joughin-presentation.pdf
Specifically on measurement, building on the work presented by Kristin and Hamish, it was agreed to form a working group to explore technical issues in more detail and try to replicate the London study in Brighton and Hove.
_______________
Simon Maxwell, Co-Chair of Climate:Change
Perspective pieces are the responsibility of the authors, and do not commit Climate:Change in any way. Comments are welcome.