
Book Review. The State of the UK Climate 2025
Book Review. The State of the UK Climate 2025
Simon Maxwell
Another day, another harrowing report about the UK’s changing climate.
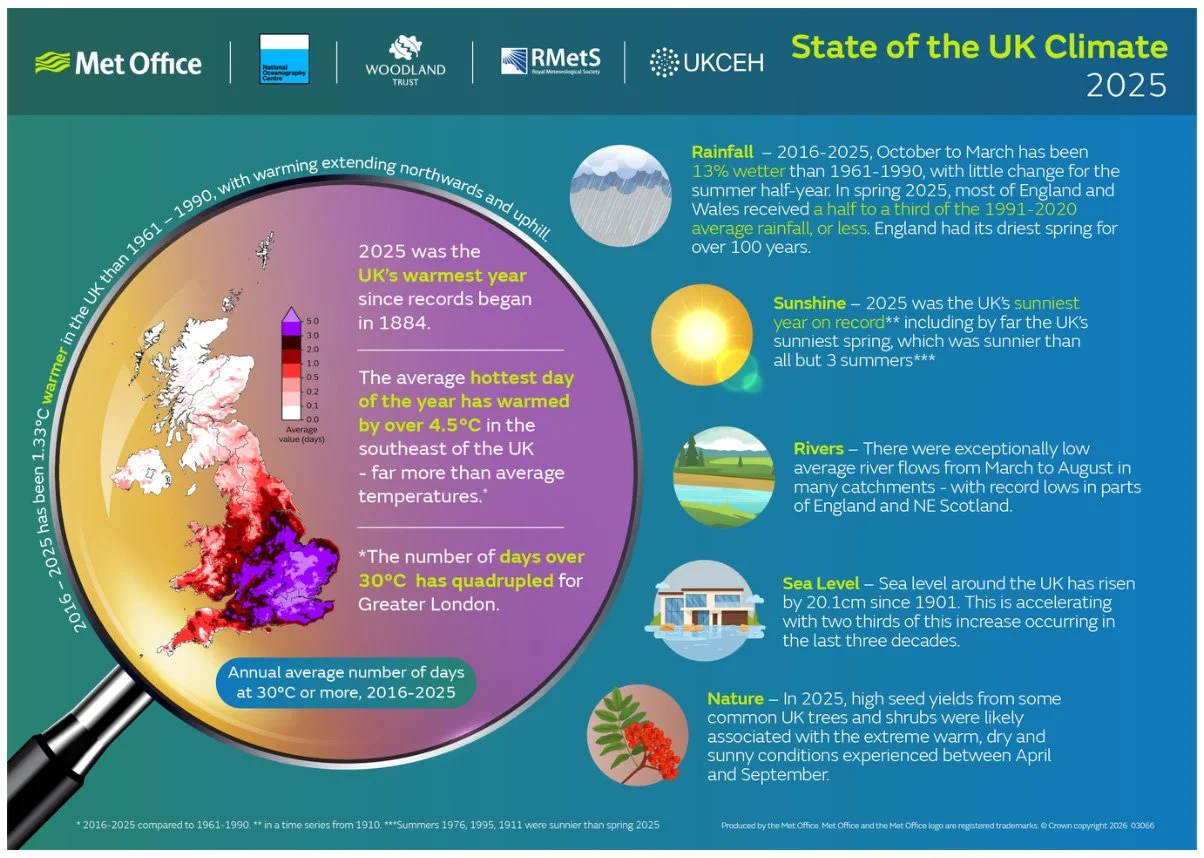
The State of the UK Climate 2025 is the latest in an annual series of reviews, led by Mike Kendon from the UK Met Office. It is a really thorough review, with excellent tables and figures, covering land and sea temperature, rainfall, sunshine, river hydrology, nature, and extreme weather events. A summary Infographic is at Figure 1, and the full Executive Summary is pasted in below for ease of reference. Do look at the full report, though: it contains a wealth of information.
Figure 1
Source: https://www.metoffice.gov.uk/research/climate/maps-and-data/about/state-of-climate
The findings are probably what we would expect. Temperatures are rising. We are getting wetter winters. Rivers are struggling. Sea levels are rising. No doubt 2026 will be worse.
Two things really struck me.
First, weather is weather, and some years will be hotter or wetter than others, or colder or drier, but what is really striking is the unambiguous evidence that the climate itself is changing, even compared to a baseline of 1961-90. I read the report and found myself mourning the climate I grew up in.
Second, the report argues that the way we experience climate change in the UK is via extremes, and that these are increasing in frequency and severity: more heat waves, more droughts, more storms, and more floods, and worse in every case. This matters for policy.
The climate is changing – on average . . .
The Report has rich detail on the reference year, 2025, but also looks at the trends, in some cases over 300 years. Thus, to take a few examples:
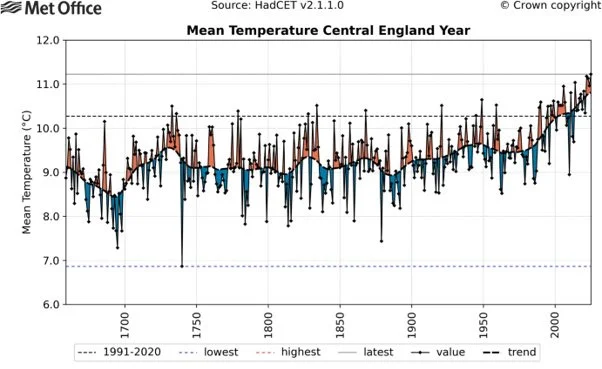
Temperature. The Central England series (Figure 2) ‘provides evidence that the 21st Century so far has overall been warmer than any period of equivalent length within the previous three centuries: 2001 to 2025 was 1.0°C warmer than 1901–2000, 1.4°C warmer than 1801–1900 and 1.3°C warmer than 1701–1800. All seasons of the 21st Century so far have also been warmer than the same seasonal average in each of the previous three centuries’.
Figure 2
Source: https://rmets.onlinelibrary.wiley.com/doi/10.1002/joc.70470
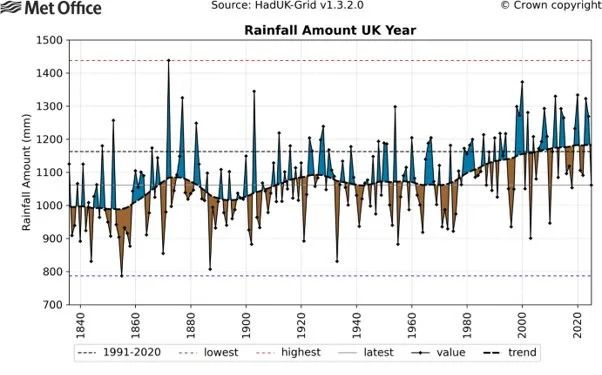
Rainfall. The UK's climate has become steadily wetter from the 1980s, becaus of an increase in winter half-year rainfall. Rainfall has increased by 8% since 1961-90. See Figure 3.
Figure 3
Source: https://rmets.onlinelibrary.wiley.com/doi/10.1002/joc.70470
Sea warming and sea level rise. UK near coastal waters have warmed steadily from the 1980s onwards. The most recent decade (2016–2025) has been on average 0.3°C warmer than the 1991–2020 average, and 1.0°C warmer than 1961–90. Meanwhile, sea level rise around the UK is accelerating. Since 1901, the sea level around the UK has risen by about 20.1 cm, with two-thirds of this rise happening over the last three decades.
There are more data points, on sunshine, river flow, seasonal imbalances, and nature. The Report concludes, notably, that ‘our climate is changing sufficiently fast that the climate of 2025 may be considered different to that of 2016’.
. . . And at the extremes
The Report makes the important point that
‘the way we experience the main effects of climate change in the UK is through the extremes; changes in averages alone (e.g. annual mean temperature or rainfall) fail to provide a sufficiently complete picture of the changing character of the UK's climate’.
Thus:
The number of days over 30°C and nights over 18°C has more than quadrupled for Greater London for the most recent decade, 2016–2025, compared to 1961–1990.
The average hottest day of the year has warmed by over 4.5°C in a swathe from Kent to Lincolnshire for the most recent decade, 2016–2025, compared to 1961–1990.
Air and ground frosts have steadily declined from the 1980s onwards, reducing by around a quarter. The number of ‘icing days’ (maximum temperature below 0°C) has more than halved for the UK for the most recent decade, 2016–2025, compared to 1961–1990, and the number of hard frosts (minimum temperature below −8°C) has reduced by a factor of more than four.
There were 297 marine heatwave days for Northwest European seas and the Northeast Atlantic in 2025, more than any other year since 1982, and exceeding the previous record of 178 days in 2023 by a wide margin
‘Taken collectively’, the report says,
‘(the) analyses demonstrate some very large changes in the frequency of both high and low temperature extremes, and that the hottest day of the year has warmed by far more than average temperatures for large parts of the UK, including the south-east and Greater London. The observational evidence demonstrates that what we regard as our ‘normal’ climate in terms of the hottest and coldest spells of weather we would typically expect in any given year has very significantly changed from what it was through most of the 20th Century.’
The proliferation of extremes has big implications for policy, for example in preparing for heat waves, floods and storm surges. The Report points out that the UK dodged a bullet with respect to Storm Éowyn in January 2025. The storm
‘occurred during neap tides, just after a new moon; had such a large storm surge occurred a week later (1 February) on top of the next spring tide of the year, the total water level would have been much higher. In this scenario, total levels at Heysham would have been 3 m more than the recorded level of 3.94 m, reaching 6.93 m above Ordnance Datum Newlyn (ODN). This extreme level is estimated to occur only around 1 in 300 years based on historic data.’
Heysham – I looked it up – is a coastal village near Morecambe, in Lancashire.
So what?
We like to use these global and national reviews as a platform to think about the implications for Brighton and Hove. On this occasion, I think, the Report implies a need for accelerated action across all our areas of work:
On adaptation, including flood prevention and managing heat;
On energy, especially demands on the grid during heat waves;
On transport and travel;
On city planning, especially the built environment.
When it comes to my personal mourning, there is a literature, and a link back to our work on behaviour change. But the final stage, after denial, anger, bargaining and depression, should not be acceptance, but action.
There is also relevance to our work with disadvantaged communities. As the Report says, there is a communication challenge emerging from the analysis: ‘It is vital that (the) changes are communicated clearly’.
That is all the more true because this is only the beginning. As Mike Kendon observed to the Guardian:
‘A final point, if you find this sobering enough, is these changes are set to continue. We’re not saying that where we are now is where we’re going to stay.’
________________
The State of the UK Climate 2025
Executive Summary
Observations continue to show unprecedented changes in the UK's climate. Recent decades have been warmer, wetter and sunnier than the 20th Century.
Temperature
The UK's climate has warmed at approximately 0.25°C per decade since the 1980s. Changes can be seen on annual, seasonal, monthly and daily timescales, with extremes affected most.
2025 was the warmest year in the UK series from 1884, with the last 4 years in the top five warmest. This is the sixth time this century this record has been set.
2025 included the UK's warmest spring and summer, with the six months, March to August, all in the top ten warmest of their respective monthly series.
The most recent decade, 2016–2025, has been 0.51°C warmer than 1991–2020, and 1.33°C warmer than 1961–1990, with warming extending northwards and uphill.
The number of days over 30°C and nights over 18°C has more than quadrupled for Greater London for the most recent decade, 2016–2025, compared to 1961–1990.
The average hottest day of the year has warmed by over 4.5°C in a swathe from Kent to Lincolnshire for the most recent decade, 2016–2025, compared to 1961–1990.
The number of ‘icing days’ (maximum temperature below 0°C) has more thanhalved for the UK for the most recent decade, 2016–2025, compared to 1961–1990, and the number of hard frosts (minimum temperature below −8°C) has reduced by a factor of more than four.
Central England Temperature
The Central England Temperature (CET) findings support those for the UK with a multi-century perspective.
The CET series shows that recent warmth has far exceeded any observed temperatures in at least 300 years.
Recent changes in the frequency of UK daily maximum and minimum temperature extremes are supported by similar changes in the 250-year daily CET series.
Air and Ground Frost
Air and ground frosts have steadily declined from the 1980s onwards, reducing by around a quarter
The most recent decade 2016–2025 has had almost a week fewer air frosts per year than the 1991–2020 average and over 2 weeks fewer than 1961–1990 and 1931–1960.
The most recent decade 2016–2025 has had 1½ weeks fewer ground frosts per year than the 1991–2020 average and 4 weeks fewer than 1961–1990.
Days of air and ground frost in 2025 were below the 1991–2020 average—although not exceptional.
Growing Degree Days
Growing degree days have steadily increased from the 1980s onwards. However, other factors such as rainfall and sunshine will also be important for plant growth.
The most recent decade 2016–2025 has had 9% more growing degree days than 1991–2020 and 24% more than 1961–1990.
Growing degree days in 2025 were the highest on record in the UK series from 1931. Six of the 10 highest GDD years have occurred in the most recent decade 2016–2025.
Near-Coast Sea-Surface Temperature (SST)
UK near coastal waters have warmed steadily since the 1980s onwards at a rate slightly lower than the warming rate over UK land. This trend has led to an increased risk of marine heatwaves.
The most recent decade (2016–2025) has been on average 0.3°C warmer than the 1991–2020 average and 1.0°C warmer than 1961–1990 for UK near-coast SST.
Five of the 10 warmest years for UK near-coast SST in a series from 1870 have occurred in the most recent decade 2016–2025. 2025 was the second warmest year, behind 2023.
2025 was the warmest year across a larger area of the Northwest European seas and the Northeast Atlantic in a series from 1982.
There were 297 marine heatwave days for Northwest European seas and theNortheast Atlantic in 2025, more than any other year since 1982 and exceeding the previous record of 178 days in 2023 by a wide margin.
Rainfall
The UK's climate has become steadily wetter from the 1980s, due to an increase in winter half-year rainfall. There is some evidence for increases in the frequency of very wet months and days.
2025was a relatively dry year overall but not exceptional. Rainfall deficits in spring and summer partially recovered in autumn.
In spring 2025, most of England and Wales received less than half the 1991–2020 average rainfall, and in some places less than a third. England had its driest spring for over 100 years.
Total annual rainfall in the most recent decade 2016–2025 has seen no change compared to 1991–2020 but has increased by 8% compared to 1961–1990.
Thewinter half-year (October to March) for the most recent decade, 2016–2025, has been 3% wetter than 1991–2020, and 13% wetter than 1961–1990, with little change for the summer half-year.
The spatial frequency of very wet months in the winter half-year (October to March) with twice the 1961–1990 average rainfall has approximately doubled from 1961–1990 to 2016–2025.
There is no clear evidence of an increase in the frequency of very dry months in either the winter half-year or the summer half-year (April to September).
Observationssuggest an increase in very wet days across the UK in recent decades, but further digitization of daily rainfall before 1961 would provide greater confidence in this result.
Sunshine
The UK's climate has become sunnier from the 1980s, primarily driven by increases in winter and spring sunshine.
2025was the sunniest year in the UK series from 1910, with 1645 sunshine hours, 117% of the 1991–2020 average.
Spring 2025 was the sunniest spring in the UK series from 1910 and also sunnier than all but three summers: 1976, 1995 and 1911.
The most recent decade 2016–2025 has been 4% sunnier than 1991–2020 and 10% sunnier than 1961–1990.
For the most recent decade 2016–2025, springs for England have been 9% sunnierthan 1991–2020 and 21% sunnier than 1961–1990, the latter equivalent to almost 1 h per day.
Extremes and Significant Weather Events
The large variability in the UK's weather on different timescales means that extreme weather events are an integral part of the UK's climate.
Storm Éowyn was the UK's most powerful wind storm for over a decade, hitting the UK in late January 2025. A gust of 87 Kt (100 mph) was recorded in Scotland.
Spring and summer 2025 combined saw a UK mean maximum temperature anomaly of +2.1°C and sunshine total 125% of the 1991–2020 average, by far the warmest and sunniest such period on record.
Springand summer 2025 combined saw less than 40% of 1991–2020 average rainfall in the driest areas, but for durations longer than 6 months the 1976 drought was far more severe.
Hydrology
River flow data from the 1960s do not show a clear overall trend in low flows, whereas there is some evidence for an increase in high flows.
MeanMarch to August river flows were ‘notably’ to ‘exceptionally’ low, withmany catchments in northern England and north-east Scotland setting newrecords, and others second or third lowest behind major summer droughtssuch as 1976, 1984 and 2022.
Marchto August 2025 total flow of rivers for England was the second lowest in arecord from 1961, lower even than several other major summer droughtsexcept 1976.
Any trends in low flows in the last six decades remain spatially uneven and rarely significant. In contrast, trends in high flows show a strong, coherent national increase, consistent with broader shifts towards higher winter half-year rainfall.
Sea-Level Rise
Sea level rise around the UK is accelerating, increasing the potential flood risk from storm surges.
Since1901, the sea level around the UK has risen by about 20.1 cm (likely range 16.6 to 23.6 cm), withtwo-thirds of this rise happening over the last three decades.
Over the past 33 years (1993–2025) the UK sea level estimated fromtide gauges has risen by 13.9 cm, although there are large uncertainties in estimates of sea level risearound the UK.
Thelast 4 years were thehighest on record for UK annual mean sea level from 1901, with the 21st Century so far (2001–2025) including the 18 highest years.
Storm surges in the UK in 2025 mostly occurred on small or moderate tides, limiting their impact.
The most severe surges were from storms Éowyn (January), Amy (October), and Bram (December). Had Éowyn arrived a week later, coinciding with a spring tide, the estimated total sea level at Heysham, Lancashire, would have made this a 1 in 300 year event.
Climate and Nature
Many species and processes in nature are closely linked with climate. In 2025, high seed yields from common UK trees and shrubs were likely associated with the extreme warm, dry and sunny conditions experienced between April and September.
In2025, Nature's Calendar citizen science observations showed the highestseed yields on record (since 2001) for some common UK tree and shrub species.
Seedyields of Blackthorn, Pedunculate oak and Sessile oak in 2025 were particularly high. For oak this phenomenon is often described as a ‘mast’ year.
_________________
Source: https://rmets.onlinelibrary.wiley.com/doi/10.1002/joc.70470
Simon Maxwell is Co-Chair of Climate:Change
Perspective pieces are the responsibility of the authors, and do not commit Climate:Change in any way. Comments are welcome.